TL;DR:
- Databricks introduces Lakehouse Monitoring for unified data and AI quality control.
- Prevent data quality issues and model degradation with proactive monitoring.
- Monitoring profiles include Snapshot, Time Series, and Inference Log.
- Custom metrics and slicing expressions provide tailored insights.
- Visualize quality metrics and set up alerts for immediate notifications.
- Fully managed quality solution for Retrieval Augmented Generation (RAG) applications.
Main AI News:
In today’s data-driven world, the quality of data and the performance of artificial intelligence (AI) models are paramount. Databricks introduces “Lakehouse Monitoring,” an innovative solution designed to address these critical concerns. Lakehouse Monitoring offers a unified approach to monitoring your data pipelines, from data ingestion to machine learning models, all within the Databricks Intelligence Platform. In this article, we will delve into the significance of Lakehouse Monitoring and how it can revolutionize the way you manage your data and AI assets.
Imagine this scenario: your data pipeline seems to be functioning smoothly, but unbeknownst to you, the data quality has slowly deteriorated over time. This is a common challenge faced by data engineers and AI teams. Often, everything appears fine until users start complaining about the unusable data.
For teams engaged in training and deploying machine learning models, tracking model performance in production and managing different versions can be an ongoing struggle. This can result in models becoming obsolete in production, requiring time-consuming rollbacks.
The illusion of smoothly operating pipelines can make it difficult for data and AI teams to meet delivery and quality service level agreements (SLAs). Lakehouse Monitoring provides a proactive solution to identify quality issues before they impact downstream processes. It allows you to stay ahead of potential problems, ensuring that your pipelines run smoothly and machine learning models remain effective over time. Say goodbye to weeks spent on debugging and rolling back changes.
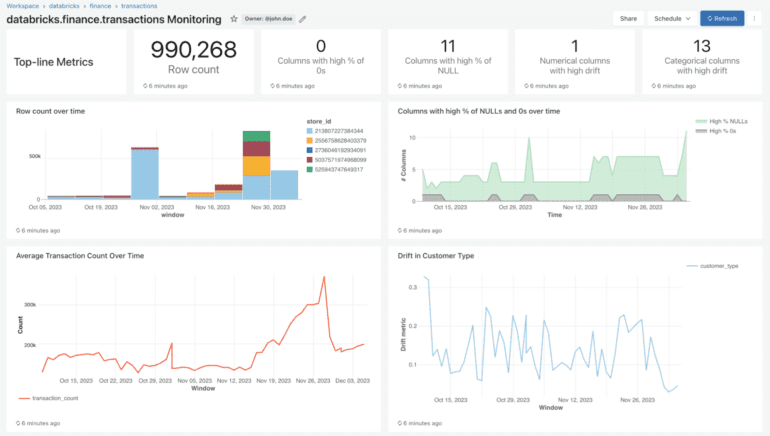
Lakehouse Monitoring simplifies the process of monitoring data quality and model performance. With just one click, you can monitor the statistical properties and quality of all your tables. It automatically generates a dashboard that visualizes data quality for any Delta table in the Unity Catalog. The product provides a comprehensive set of metrics, including model performance metrics (e.g., R-squared, accuracy) for inference tables and distributional metrics (e.g., mean, min/max) for data engineering tables. Additionally, you can configure custom metrics to meet your specific business needs.
Lakehouse Monitoring keeps your dashboard up-to-date according to your specified schedule, storing all metrics in Delta tables. This enables you to perform ad-hoc analyses, create custom visualizations, and set up alerts.
Configuring Monitoring
Setting up monitoring is straightforward. You can configure monitoring profiles for your data pipelines or models:
- Snapshot Profile: Monitor the full table over time or compare data to previous versions or a known baseline.
- Time Series Profile: Compare data distributions over time windows (e.g., hourly, daily) if your table contains event timestamps. This profile is enhanced by the Change Data Feed feature for incremental processing.
- Inference Log Profile: Track model performance and input-output shifts over time. You can include ground truth labels for drift analysis and demographic information for fairness and bias metrics.
You can choose the monitoring frequency to ensure data freshness. Many users opt for daily or hourly schedules, while some trigger monitoring directly at the end of data pipeline execution using the API.
To further customize monitoring, you can define slicing expressions to monitor specific subsets of the table and create custom metrics based on columns.
Lakehouse Monitoring offers a customizable dashboard that visualizes profile metrics (summary statistics) and drift metrics (statistical drift) over time. This allows you to monitor data quality and model performance with ease. You can also create Databricks SQL alerts to be notified of threshold violations and data distribution changes.
Alerts are a crucial component of Lakehouse Monitoring. You can set up alerts for computed metrics to receive notifications about potential errors or risks. For example:
- Get alerted if the percentage of nulls and zeros exceeds a threshold or changes over time.
- Monitor model performance metrics like toxicity or drift and receive alerts when they fall below specified quality thresholds.
With insights from alerts, you can identify whether a model needs retraining or if there are issues with your source data. After addressing these issues, you can manually trigger a refresh to update your pipeline’s metrics. Lakehouse Monitoring empowers you to proactively maintain the health and reliability of your data and models.
Lakehouse Monitoring goes even further by offering a fully managed quality solution for Retrieval Augmented Generation (RAG) applications. It scans application outputs for toxic or unsafe content, allowing you to quickly diagnose errors caused by issues such as stale data pipelines or unexpected model behavior. Lakehouse Monitoring takes care of monitoring pipelines, freeing developers to focus on their applications.
Conclusion:
Databricks’ Lakehouse Monitoring is a game-changer for organizations seeking to ensure data quality and AI model performance. Its unified approach, ease of setup, and robust customization options make it a valuable asset for data engineers, data scientists, and AI practitioners. By proactively monitoring your data and AI assets, you can prevent issues before they impact your business, saving time and resources while maintaining high-quality data pipelines and models. Embrace Lakehouse Monitoring and unlock the potential of your data and AI initiatives.

