TL;DR:
- MIT researchers have introduced the VisText dataset, aiming to enhance accessibility and comprehension of complex charts and graphs.
- The dataset trains machine-learning models to generate precise and semantically rich captions, accurately describing data trends and intricate patterns.
- VisText surpasses other auto-captioning systems by producing varied and accurate captions that cater to the diverse needs of users.
- The dataset incorporates insights from user preferences, enabling adaptive captions for individuals with visual impairments or low vision.
- Scene graphs extracted from chart images serve as a realistic representation, bridging the gap between visual content and large language models.
- Models trained with scene graphs show promising performance, rivaling those trained with data tables.
- The researchers propose auto-captioning systems as authorship tools, empowering users to edit and verify captions, mitigating potential errors and ethical concerns.
- Future goals include expanding the VisText dataset with diverse chart types and gaining deeper insights into auto-captioning models.
Main AI News:
In an exciting leap forward for accessibility and comprehension of intricate charts and graphs, MIT researchers have unveiled a remarkable innovation: the VisText dataset. This revolutionary dataset aims to transform automatic chart captioning systems by training machine-learning models to generate adaptive, detail-rich captions that precisely depict data trends and intricate patterns.
Captioning charts have long been a time-consuming process that requires additional contextual information to improve comprehension. Traditional auto-captioning techniques have struggled to incorporate cognitive features that enhance understanding. However, the MIT researchers discovered that their machine-learning models, trained using the VisText dataset, consistently outperformed other auto-captioning systems. The generated captions were not only accurate but also varied in complexity and content, catering to the diverse needs of different users.
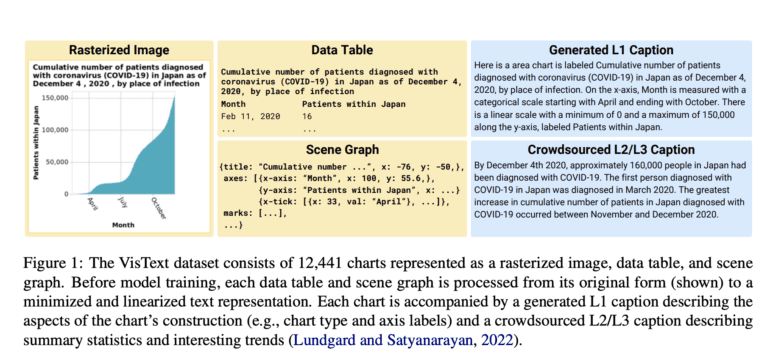
The inspiration for VisText originated from MIT’s Visualization Group, which delved into the crucial elements of an effective chart caption. Their research revealed that individuals with visual impairments or low vision, as well as sighted users, exhibited varying preferences for the complexity of semantic content within a caption. Building upon this human-centered analysis, the researchers meticulously constructed the VisText dataset, featuring over 12,000 charts represented as data tables, images, scene graphs, and their corresponding captions.
Developing effective auto-captioning systems presented numerous challenges. Existing machine-learning methods approached chart captioning similarly to image captioning, but interpreting natural images significantly differs from reading charts. Alternative techniques disregarded the visual content entirely, relying solely on underlying data tables that are often unavailable after chart publication. To overcome these limitations, the researchers harnessed the power of scene graphs extracted from chart images as a representation. Scene graphs offered the advantage of containing comprehensive information while being more accessible and compatible with modern large language models.
Five machine-learning models were trained for auto-captioning using VisText, employing different representations such as images, data tables, and scene graphs. The researchers made a significant discovery – models trained with scene graphs performed just as well, if not better, than those trained with data tables, highlighting the potential of scene graphs as a more realistic representation. Moreover, by training models separately with low-level and high-level captions, the researchers enabled the models to adapt to the complexity of the generated captions.
Ensuring the accuracy and reliability of their models, the researchers conducted a thorough qualitative analysis, meticulously categorizing common errors made by their best-performing method. This examination proved vital in understanding the subtle nuances and limitations of the models, shedding light on ethical considerations surrounding the development of auto-captioning systems. While generative machine-learning models provide a powerful tool for auto-captioning, misinformation can spread if captions are generated incorrectly. Addressing this concern, the researchers proposed auto-captioning systems as authorship tools, empowering users to edit and verify the captions, thereby mitigating potential errors and ethical concerns.
Looking ahead, the team remains dedicated to refining its models to reduce common errors. Their aspirations include expanding the VisText dataset to include more diverse and complex charts, such as those with stacked bars or multiple lines. Furthermore, they aim to gain deeper insights into the learning process of auto-captioning models, seeking a profound understanding of chart data.
Conclusion:
MIT’s groundbreaking VisText dataset has the potential to revolutionize the market for automatic chart captioning systems. With its precise and semantically rich captions, catering to the diverse needs of users, VisText enhances accessibility and comprehension of complex charts and graphs. The use of scene graphs as a representation bridges the gap between visual content and language models, presenting a more realistic approach. As auto-captioning systems evolve into authorship tools, allowing users to edit and verify captions, concerns about misinformation are addressed. The future holds further advancements and research in auto-captioning, promising a more inclusive and accessible market for individuals with visual disabilities.

